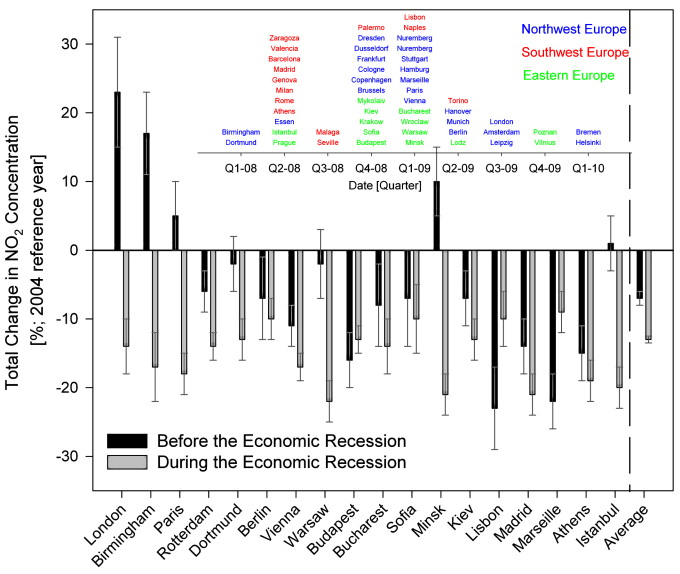
Figure 6. The calculated total relative change in NO2 concentration before and during the economic recession for 18 large European cities with more than 500,000 inhabitants.
Black bars indicate the total relative change in NO2 between 2004 and the estimated start of the economic recession (the business-as-usual time period where economic growth is offset by environmental policy). Grey bars indicate the change in NO2 during the yearlong economic recession (also relative to 2004). The average value is for all European cities with populations greater than 500,000 (see Figure S6). The areas considered for each city correspond to the average of the closest co-located grid cell and the surrounding 8 grid cells. The mid-date of the economic recession (inset city names) was estimated as the date with the observed highest rate of NO2 column decrease (minimum NO2 first derivative with respect to time) after 2008.

