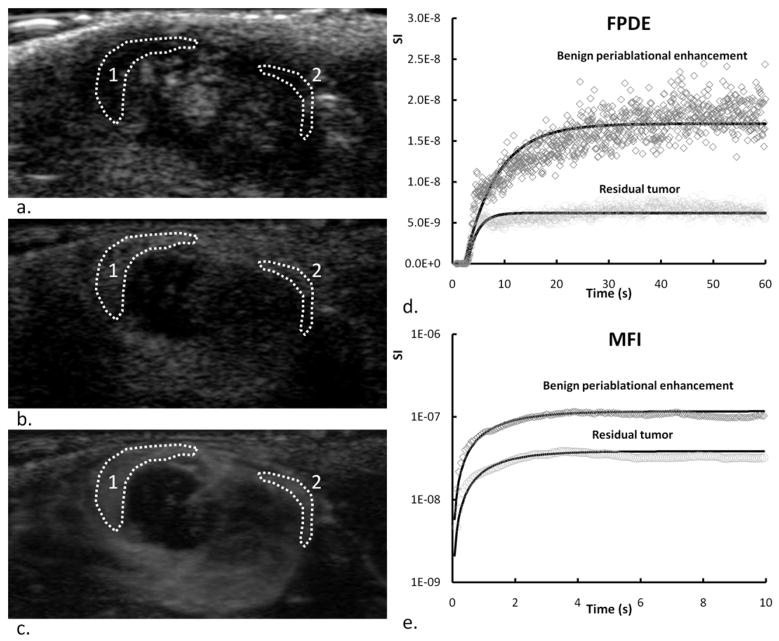
Fig. 2.
2D US (a), FPDE (b) at peak enhancement and MFI (c) images at 40 s after injection of a representative tumor on day 4 after RF ablation. ROIs in BPE (1) and residual tumor (2) were drawn manually. Contrast uptake kinetics of the first pass dynamic enhancement and of the MFI processing in the two ROIs (d, e). Corresponding fitted curves using a mono-exponential perfusion model are shown on the same plots.

