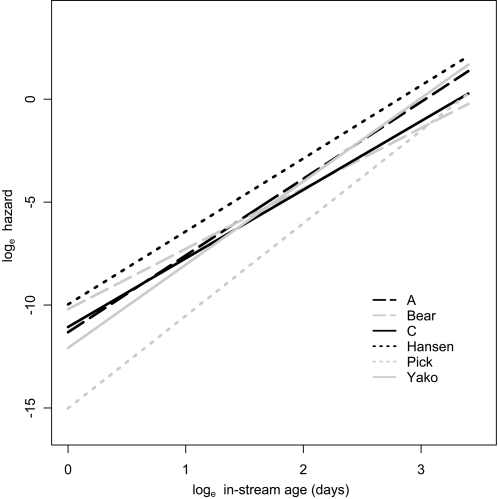
Figure 3. Hazard.
Population-specific hazard functions (y-axis) plotted against in-stream age (x-axis). These functions are based on a mean day of entry and on population-specific day of entry parameters. The higher the hazard for a given in-stream age, the greater the senescence rate at that age. The slopes of these lines represent variation in the shape of the hazard function (α) and the elevation of the lines represent variation in their magnitude given the shape (λ).

