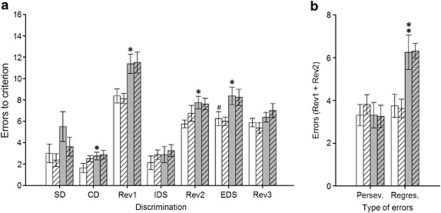
Figure 4.
Performance of both saline- (white bars) and PCP-treated rats (gray bars) in the attentional set-shifting task after an administration of either vehicle (blank bars) or LSN2463359 (striped bars) (N=8 per group). Graph bars represent the mean±SEM of the number of errors made to reach the criterion in each test discrimination (a) and the average number of perseverative vs regressive errors made within the first two reversal learning discriminations (b). Symbols: #p<0.001 vs the saline/veh-treated group at the IDS discrimination; *p<0.05 and **p<0.01 vs the saline/veh-treated group within the same discrimination (a) or error type category (b).

