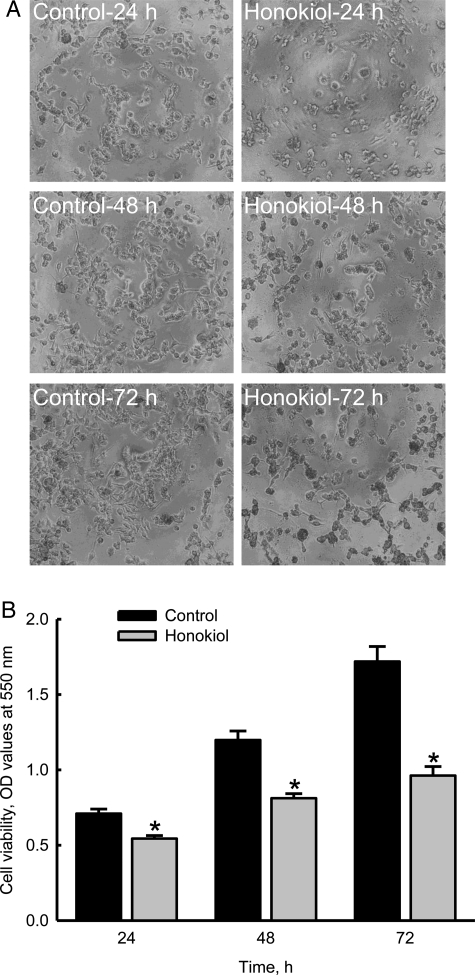
Fig. 3.
Time-dependent effects of honokiol on the death of neuroblastoma cells. Neuro-2a cells were treated with 40 µM honokiol for 24, 48, and 72 h. Cell morphologies were observed and photographed using a reverse-phase microscope (A). Cell viability was assayed using a colorimetric method (B). Each value represents the mean ± standard error of the mean for n = 6. *The value significantly differs from the respective control, P < .05.

