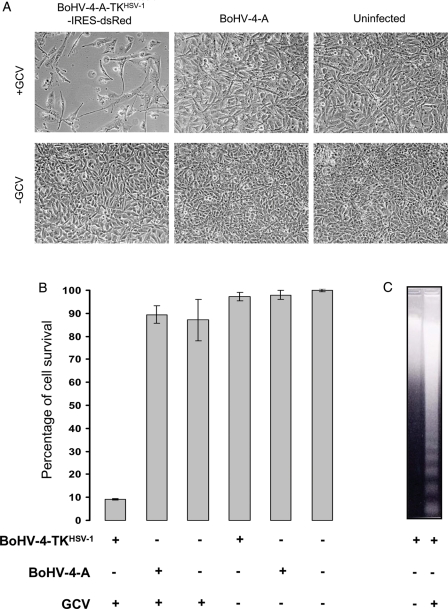
Fig. 4.
A, Phase contrast microscope images of RD-4 cells (10X) infected with BoHV-4-A-TKHSV-1-IRES-dsRed (BoHV-4TKHSV1) or BoHV-4-A and treated (GCV+) or untreated (GCV−) with GCV. B, Infection and treatment quantified by MTT assay. (The data presented are the means ± standard errors of three different experiments). C, Representative images of apoptotic cell death detected by DNA laddering in cells infected with BoHV-4-A-TKHSV-1-IRES-dsRed (BoHV-4-TKHSV1) and treated with GCV but not with the other combinations of infection/treatment.

