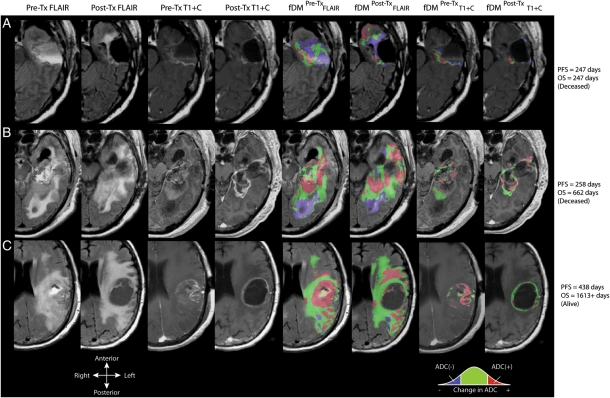
Fig. 1.
Anatomical MRIs and functional diffusion maps (fDMs) for 3 patients with glioblastoma. From left column to right column: pretreatment fluid-attenuated inversion recovery (FLAIR); posttreatment FLAIR; pretreatment, postcontrast T1-weighted images (T1 + C); posttreatment T1 + C; fDMs in pretreatment FLAIR regions of interest (ROIs); fDMs in posttreatment FLAIR ROIs; fDMs in pretreatment T1 + C ROIs; and posttreatment T1 + C ROIs. (A) Patient with a short progression-free survival (PFS) and overall survival (OS), demonstrating a large volume fraction of voxels with decreased ADC (blue) relative to pretreatment ADC maps. (B) Patient with a short PFS but relatively longer OS demonstrates a mixed response of both voxels with a significant increase in ADC (red) and decrease in ADC (blue). (C) Long-term survival patient demonstrating a large volume fraction of tissue with increased ADC (red) and a small volume fraction of tissue with decreased ADC (blue).

