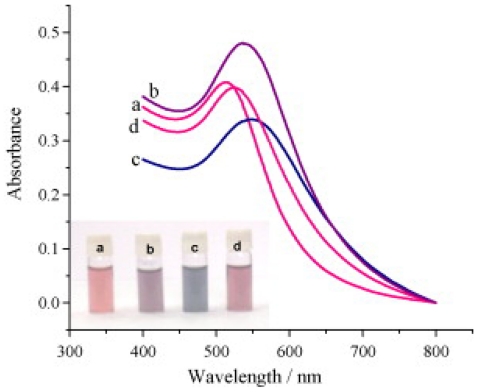
Figure 1.
Absorption spectra illustrating the protamine-induced aggregation and heparin-driven de-aggregation of AuNPs. (a) AuNPs alone; (b, c) after the addition of protamine: (b) 0.7 μg/ml and (c) 1.6 μg/ml; (d) after the addition of heparin (10.2 μg/mL). Inset shows the corresponding colorimetric response [14].

