Figure 4.
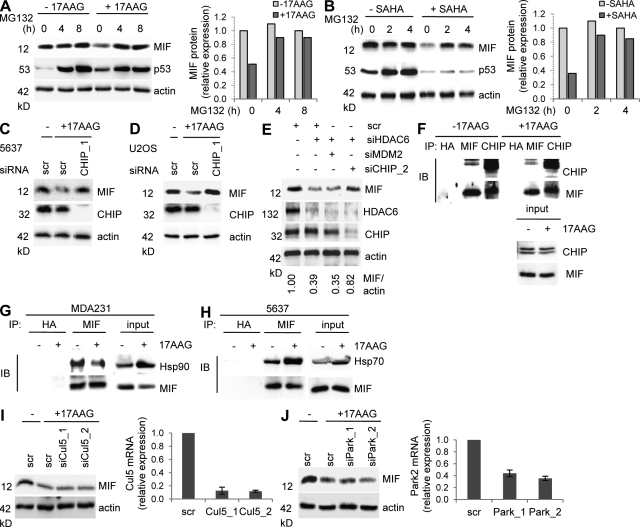
CHIP ubiquitin E3 ligase is required for MIF degradation after Hsp90 inhibition in cancer cells. (A and B, Left) U2OS cancer cells were left untreated or treated with 5 µM each 17AAG (A) or SAHA (B) for 24 h with or without 10 µM of the proteasome inhibitor MG132 for the indicated final hours. Representative immunoblot analysis from three independent experiments. WT p53 serves as positive control for proteasome inhibition. Actin, loading control. (A and B, Right) Densitometric evaluations of representative immunoblots from the left. Each MIF value was normalized to its corresponding actin value. Relative values were calculated setting control cells at 0 h and without 17AAG to 1. (C and D) 5637 (C) and U2OS (D) cells were transfected with siRNA against CHIP (siCHIP_1) or control siRNA (scr). 2 d after transfection, cells were treated with 5 µM 17AAG for 24 h and MIF stability was analyzed. Representative immunoblots from two independent experiments. Actin, loading control. (E) MDA231 cells were cotransfected with siHDAC6, siMDM2, siCHIP_2, or control siRNA (scr). After 3 d, MIF levels were assessed by immunoblotting. Actin, loading control. The representative immunoblot was quantified and relative values (MIF/actin ratio) were calculated setting scr control to 1. (F) 5637 cells were treated with 5 µM 17AAG for 24 h. MG132 was added for the final 6 h. Whole cell lysates normalized for equal levels of MIF (see input) were immunoprecipitated with anti-MIF, anti-CHIP, or anti-HA control antibody (IP). MIF-bound CHIP and CHIP-bound MIF were detected by immunoblots. (G) MDA231 cells were treated with 5 µM 17AAG for 24 h. Whole cell lysates normalized for equal levels of MIF were immunoprecipitated with anti-MIF or anti-HA control antibody (IP). MIF-bound Hsp90 was detected by immunoblot. (H) 5637 cancer cells were treated as described in Fig 4 F. Whole cell lysates normalized for equal levels of MIF (see input) were immunoprecipitated with anti-MIF or anti-HA control antibody (IP). MIF-bound Hsp70 was detected by immunoblotting. (I and J) U2OS cells were transfected with two different siRNAs against Parkin (G) or Cul5 (H) or with control siRNA (scr). At 2 d after transfection, cells were cultured in parallel with 5 µM 17AAG for 24 h and MIF protein levels were analyzed by immunoblotting (left). Parkin and Cullin 5 mRNA transcripts were measured by quantitative RT-PCRs normalized to GAPDH expression (right, bar graphs). Error bars indicate the mean of two independent experiments in triplicates each.

