Figure 1.
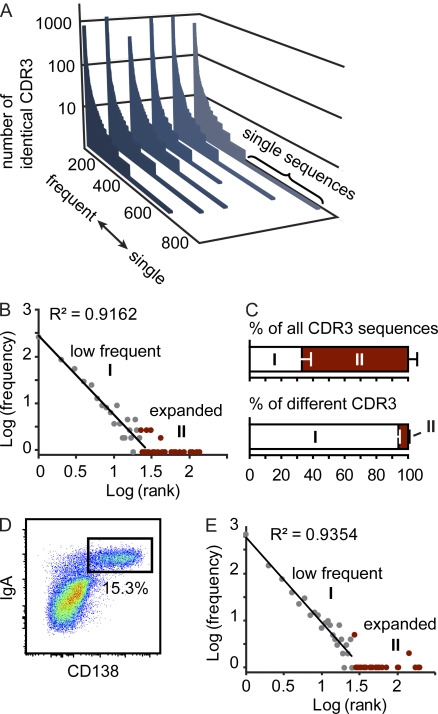
The IgA repertoire comprises highly expanded and low frequency clones. (A) In a set of 5,000 sequences, all different CDR3 sequences were listed along the x axis from frequent to single sequences, and the number of sequence reads for each different CDR3 sequence were displayed on the y axis. Each slice represents an independently analyzed mouse. (B) Log(frequency) versus log(rank) diagram for one representative mouse reveals two components of the CDR3 population. A first component (I) follows power law characteristics and comprises clones present at low frequency. A second component (II) comprises highly expanded clones and appears as a long tail in the diagram and is marked in red. (C) Bars depict the contribution of both components to all CDR3 sequences and different CDR3 sequences (mean + SD). All data are based on the analysis of six 10–11-wk-old C57BL/6 mice housed under SPF conditions. (D) Representative pseudocolor plot demonstrating IgA/CD138 staining gated on live (DAPI−) single SI lamina propria cells. (E) Log(frequency) versus log(rank) diagram of 5,000 CDR3 sequences obtained from sorted IgA+CD138+ plasma cells pooled from two 10-wk-old C57BL/6 mice. Results are representative of four independent experiments performed.

