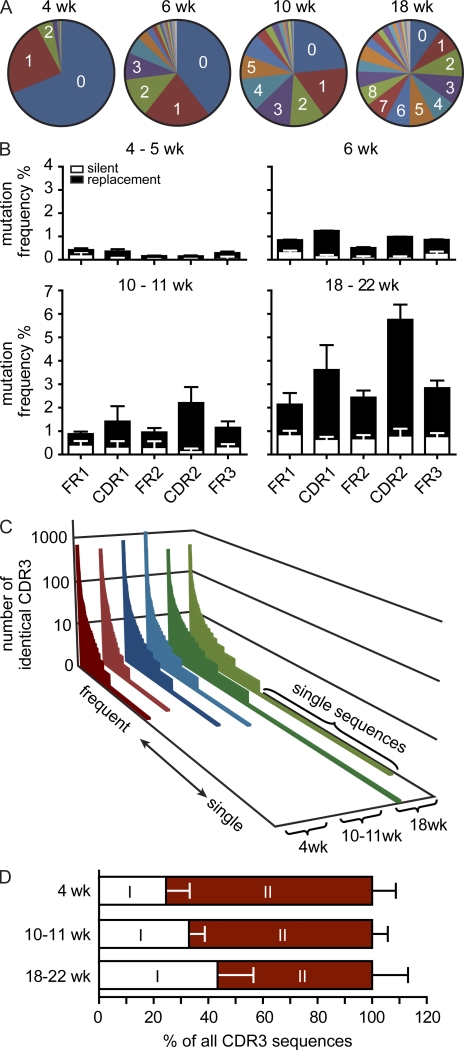
Figure 5.
IgA repertoire diversity increases with age. (A) Diagrams depict the number of SMs observed in representative 4-, 6-, 10-, and 18-wk-old mice. (B) Bars depict mean + SD SM frequencies in FR1, FR2, FR3, CDR1, and CDR2 observed in the following number of animals: 4–5 wk, n = 4; 6 wk, n = 2; 10–11 wk, n = 6; and 18–22 wk, n = 5. (C) CDR3 sequences were sorted by rank, from high to low frequency, and the number of identical sequences was plotted (compare with Fig. 1 A). Please note that the number of unique sequences increased with age. (D) Bars depict the contribution of both components to all CDR3 sequences (mean + SD).

