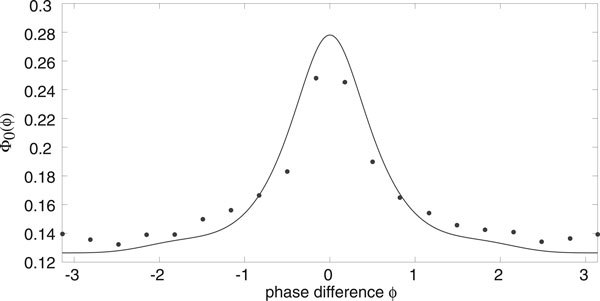
Figure 12.

Probability distribution of the phase difference between a pair of excitatory networks with synaptic depression with g, h given by Fig. 11. Solid curves are based on analytical calculations, whereas black filled circles correspond to stochastic simulations of the phase-reduced Langevin equation. Same parameters as Fig. 9(b).
