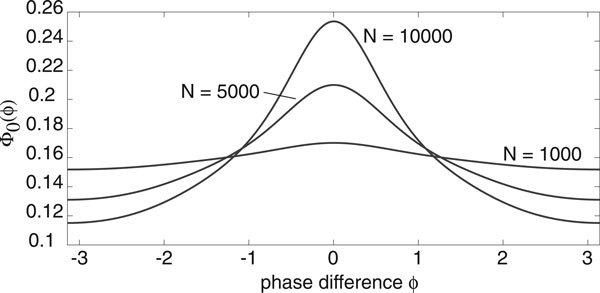
Figure 5.

Probability distribution of the phase difference between a pair of E-I oscillators as a function of system size N for fixed extrinsic noise σ = 0.08 with g, h given by Fig. 4. Increasing N causes the curve to have a much sharper peak and much more synchronization.
