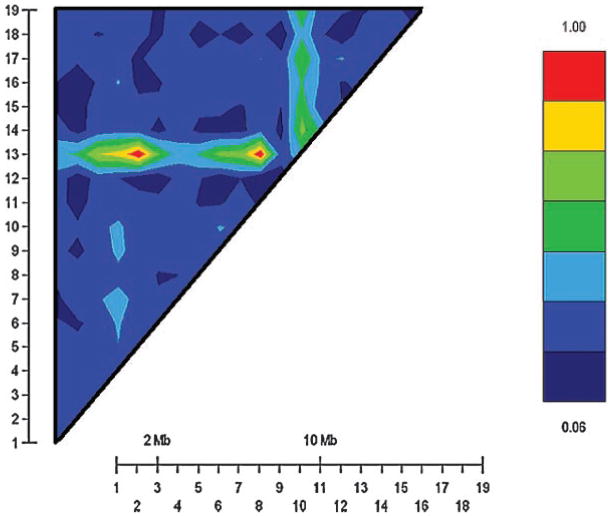
Fig. 2.
Evaluation of linkage disequilibrium (LD) in the 19 markers considered in the linkage analysis. These markers are D11S4046 (1), D11S1338 (2), D11S902 (3), D11S904 (4), D11S905 (5), D11S4191 (6), D11S987 (7), D11S1314 (8), D11S937 (9), D11S4175 (10), D11S4090 (11), C957T (12), A-241G (13), D11S908 (14), D11S4127 (15), D11S925 (16), D11S4151 (17), D11S1320 (18), D11S968 (19). D11S905 (5) and A-241G (13) exhibit strong LD, but they are over 70 cM apart and the LD was not statistically significant (P = 0.27). The intense LD between D11S4090 (11) and A-241G (13) is also not statistically significant (P = 0.39).

