
Figure 1.
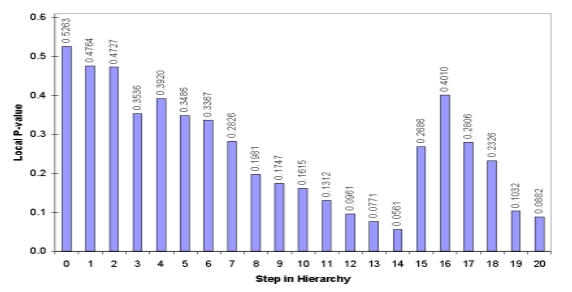
Results from haplotype association tests applied to all steps of the hierarchical structure formed by clustering data from Hoehe et al. [2]. This bar graph presents the local p-values computed by our group at all steps within the hierarchical structure.