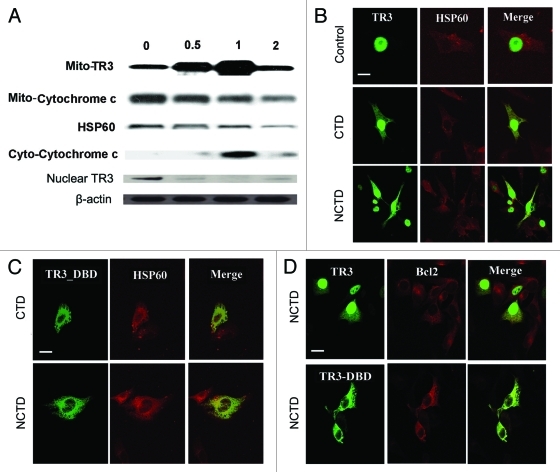
Figure 3.
NCTD induces TR3 mitochondrial translocation in melanoma cells. (A) Melanoma cells were treated with NCTD (6.5 µM) for 0–2 h. Mitochondrial (for TR3 and cytochrome C), cytoplasmic (for cyto-cytochrome C) or nuclear (for TR3) proteins were isolated from the melanoma cells and analyzed by protein gel blot analysis. HSP60 was used as a loading control for mitochondrial proteins. β-actin was used as a loading control for total protein. Representative blot from three repeats was shown. (B) Melanoma cells were transfected with TR3-GFP and then treated with PBS, CTD or NCTD for 3 h. HSP60 staining was used to visualize the mitochondria in the cytoplasm. Representative fluorescent images of tumor cells after treatment were shown (n = three repeats). Bars indicate 10 μm. (C) Melanoma cells were transfected with TR3-GFP/ΔDBD and then treated with CTD or NCTD for 3 h. HSP60 staining was used to visualize the mitochondria in the cytoplasm. Representative fluorescent images of tumor cells after treatment were shown (n = three repeats). Bar indicates 10 μm. (D) Melanoma cells were transfected with either GFP-TR3 or GFP-TR3-ΔDBD, and then treated with NCTD for 3 h. BCL-2 staining was performed. Representative fluorescent images of tumor cells after treatment were shown (n = three repeats). Bar indicates 10 μm.

