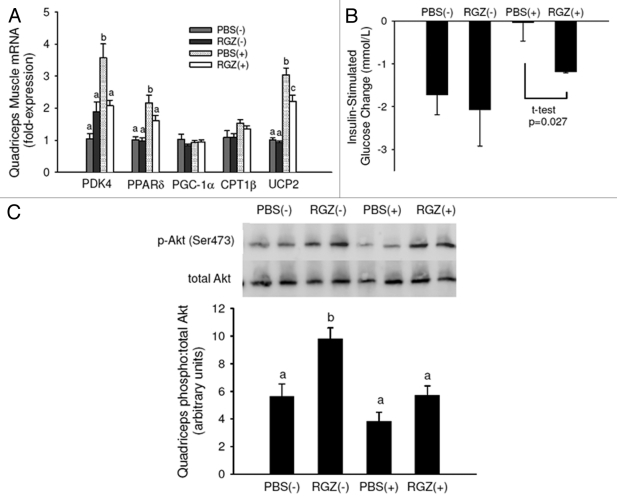
Figure 4.
Early-stage cachexia quadriceps muscle gene expression and insulin sensitivity. (A) Quadriceps muscle mRNA expression in mice with (+) and without (-) tumors and treated daily with RGZ or PBS. n = 4 for PBS(-) and RGZ(-), n = 12 for PBS(+) and RGZ(+). Different letters represent significant differences between groups for each gene (p < 0.05). (B) After an overnight fast, blood glucose was tested before and 15 min after insulin administration (IP injection, 0.75 U/kg body weight). The graph represents glucose change in 15 min. PBS(+) and RGZ(+) are significantly different using a Student’s t-test. n = 4–5 mice per group. (C) Mice were sacrificed after 15 min glucose test and quadriceps Akt activation measured with protein gel blot. Pictured is relative density of the ratio of phosporylated (Ser473) to total Akt with representative blots. n = 3–5 mice per group.

