Figure 5.
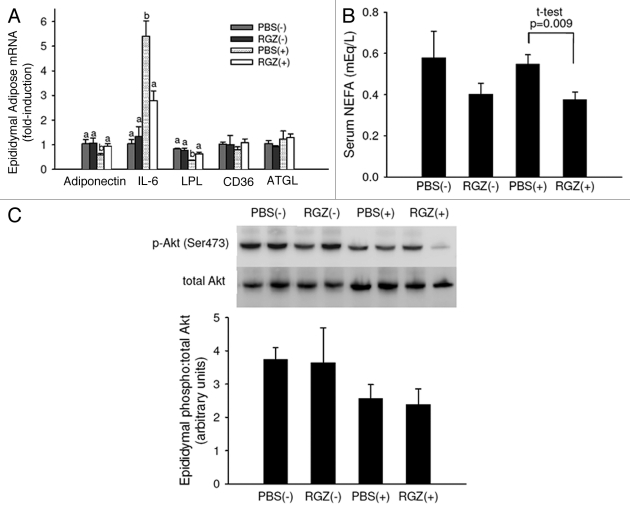
Early-stage cachexia epididymal adipose gene expression and Akt activation, and serum NEFA. (A) Epididymal adipose mRNA expression in mice with (+) and without (-) tumors and treated daily with RGZ or PBS. n = 4 for PBS(-) and RGZ(-), n = 12 for PBS(+) and RGZ(+). Different letters represent significant differences between groups for each gene (p < 0.05). (B) Fasting serum NEFA. n = 4 for PBS(-) and RGZ(-) and n = 9–11 for PBS(+) and RGZ(+). Tumor-bearing groups are significantly different using a Student’s t-test. (C) Mice were sacrificed 15 min after insulin administration (IP injection, 0.75 U/kg body weight) and epididymal Akt activation measured with protein gel blot. Pictured is relative density of the ratio of phosporylated (Ser473) to total Akt with representative blots. n = 3–5 mice per group.

