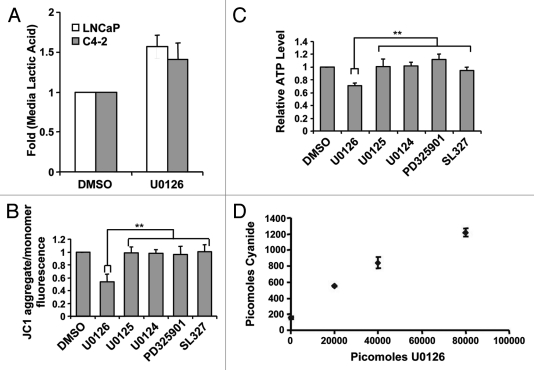
Figure 3.
U0126 induces a metabolic shift in prostate cancer cells. (A) Lactic acid levels in the medium of LNCaP and C4–2 cells were assayed 24 h after treatment with U0126. DMSO was used as a vehicle. (B) Mitochondrial potential was assayed at 12 h after dosing various MEK inhibitors in C4–2 cells. (C) Cellular ATP levels were measured 9 h after treatment with U0126. Prior to assay, cells were preincubated with 10mM 2-deoxygluocse for 30 min to inhibit glycolytic ATP production, but not mitochondrial production. (D) Cyanide levels detected in cell lysates exposed to different concentrations of U0126 for 24 h. **p < 0.05, two-tailed Student’s t-test.

