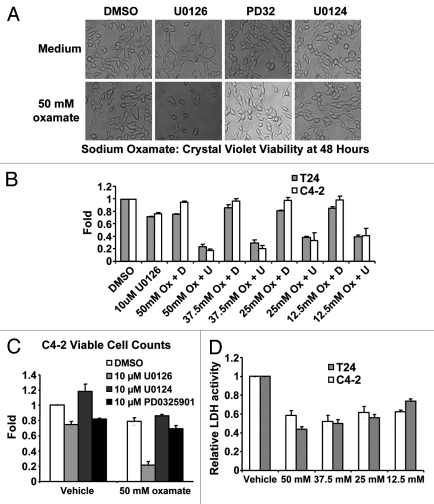
Figure 4.
Biological consequences of mitochondrial inhibition by U0126. (A) Cell morphology of C4–2 cells 48 h after drug treatment. U0126, U0124 were dosed at 10uM and PD325901(PD32) was dosed at 1 μM. (B) Crystal violet staining of C4–2 and T24 cells at 48 h after treatment with DMSO (D) or U0126 (U) and varying concentrations of sodium oxamate (Ox). (C) Viable cell counting with trypan blue of C4–2 cells 48 h after treatment with the indicated drugs. (D) Lactate dehydrogenase (LDH) enzyme activity from cell lysates incubated with varying concentrations of sodium oxamate to verify LDH inhibition.

