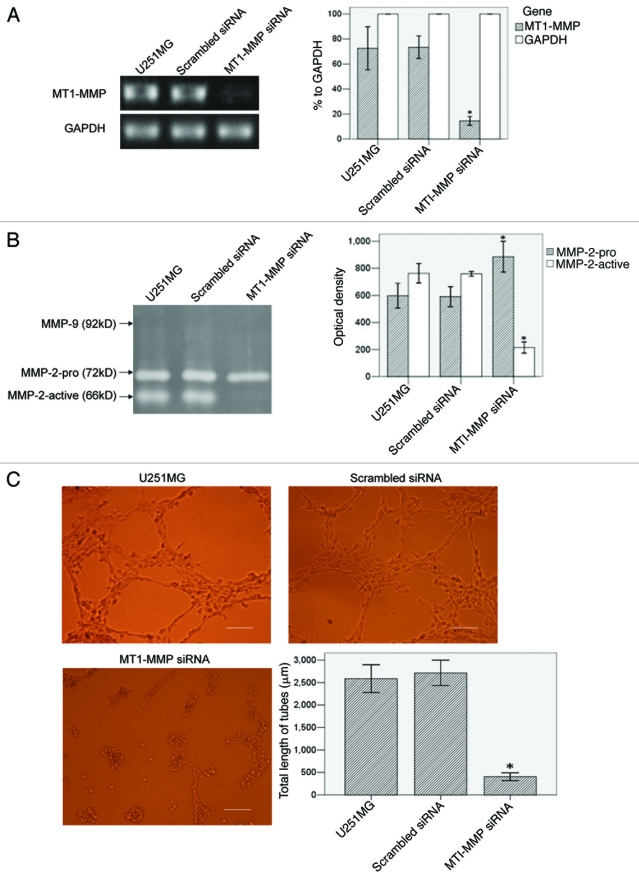
Figure 5 (See p. 984).
The influence of MT1-MMP inhibition on VM formation in U251MG. (A) RT-PCR analysis of MT1-MMP and GAPDH. GAPDH served as an internal control. MT1-MMP transcript was evaluated by OD and compared. The OD of GAPDH was considered 100% relative to MT1-MMP in each group. (B) Gelatin zymography analysis of MMP-2 and MMP-9 activities in different groups. MMPs activities were evaluated by OD and compared. (C) VM tube formation assay in different groups of U251MG. U251MG cells with different treatments were seeded onto the surface of wells of a 24-well plate coated with Matrigel at a concentration of 2.5 × 10⁵ cells/ml for 24 h and photographed. Scale bar = 200 μm. Total length of VM tubes per field in 100 × scope was compared between groups. *p < 0.01 compared with untreated U251MG.

