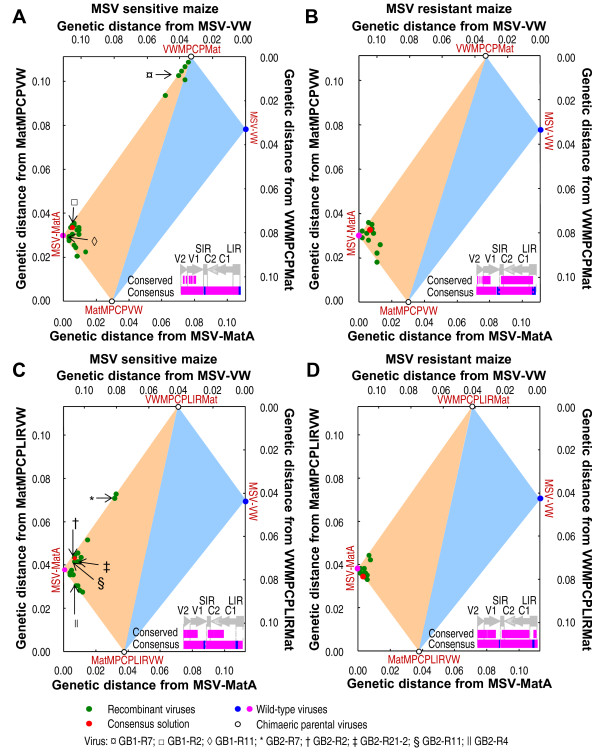
Figure 3.
Distribution of recombinant viruses arising in maize within a two dimentional projection of the sequence space bounded by wild-type and chimaeric parental viruses. A Hamming distance graph showing the effects of maize genotype and chimaeric parental sequence pairs on how precisely the recombinant genotypes that arise during mixed infections converge on the target solution, MSV-MatA. Each green circle represents a single recombinant virus obtained using the MatMPCPVW+VWMPCPMat chimaeric pair in (A) MSV-sensitive and (B) MSV-resistant maize, and MatMPCPLIRVW+VWMPCPLIRMat chimaeric pair in (C) MSV-sensitive and (D) MSV-resistant maize. The red circle in each graph indicates the position of the consensus solution. The genome schematic embedded within each graph shows the regions in pink and blue derived from, respectively, MSV-MatA and MSV-VW. The conserved regions and overall consensus solutions are shown. The genome regions are as indicated in the legend of Figure 1. The viability of the viruses indicated using the symbols ¤ (GB1-R7), (GB1-R2), ◊ (GB1-R11), * (GB2-R7), † (GB2-R2), ‡ (GB2-R21-2), § (GB2-R11), || (GB2-R4) is shown in Figure 4.

