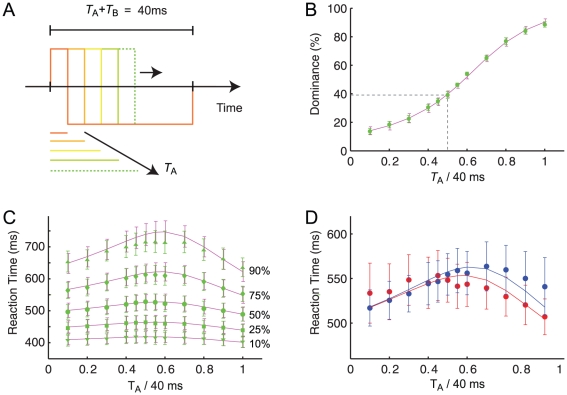
Figure 3. Experiment 2.
(A) A vernier (stimulus ‘A’) of duration  is followed by a second vernier with opposite offset direction (stimulus ‘B’) of duration
  . (B) The longer the first vernier stimulus is presented, the stronger is its dominance (green circles). If first and second verniers are of the same duration, the second vernier dominates performance, i.e. performance is below 50% (dashed line). Relative vernier duration,
  , is plotted on the abscissa, mean vernier dominance across observers is plotted on the ordinate. The two-stage model (purple line) fits the psychophysical data well. (C) The 10% (downward pointing triangles) and 25% fastest responses (squares) vary only slightly with the relative vernier duration. The median (circles), the 75% quantile (diamonds) and 90% quantile show a strongly inverted U-shaped pattern (mean across observers). When either the first or the second vernier clearly dominate performance, response times are shorter than when first and second vernier are equally long (relative vernier duration 0.5). The two-stage model (purple lines) fits the psychophysical data well. (D) Mean response times across observers for the responses to the first vernier (red circles) and the second vernier (blue circles) show a similar pattern. The two-stage model captures this behavior well (solid lines). Error bars represent SEM.

