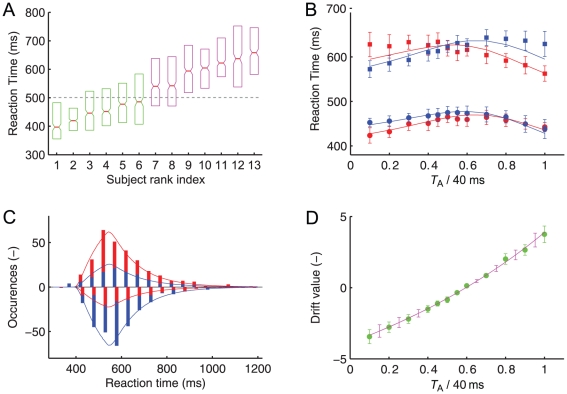
Figure 4. Experiment 2, continued.
(A) Slow and fast responders in experiment 2. Box-plots of the reaction times for all 13 observers. A vernier stimulus was followed by a second vernier with opposite offset direction of 20 ms duration each. The lower and upper boundaries of the boxes represent the first and third quartile of the reaction time distribution. The median and its 95% confidence interval are indicated by the central line and the notch. Observers are ordered according to median response times. We separate observers in two groups. One group (green boxes) has median response times faster than 500 ms (dashed horizontal line), the other group slower than 500 ms (purple boxes). (B) Mean reaction time as a function of relative vernier duration for the first vernier (red symbols) and the second vernier (blue symbols) for fast responders (squares) and slow responders (circles). The solid lines represent the fit of the two-stage model. (C) Reaction time histograms of a typical observer showing responses to the first vernier (in red) and the second vernier (in blue). Responses are plotted for two stimulus conditions, where either the first vernier dominates (positive values; first vernier stimulus was presented for 32 ms followed by the second vernier of 8 ms) or the second vernier dominates (negative values; first vernier stimulus was presented for 8 ms followed by the second vernier of 32 ms). The solid lines are the corresponding two-stage model fits. The reaction time distributions for the other 12 observers are shown in the Supporting Figure S1. (D) The drift of the two-stage model (purple line) compared to the alternative two-stage model where the drift parameter was optimized for each stimulus condition independently (green circles). All other parameters are kept constant across different stimulus conditions but are different for each observer. Error bars represent SEM for both model variants.

