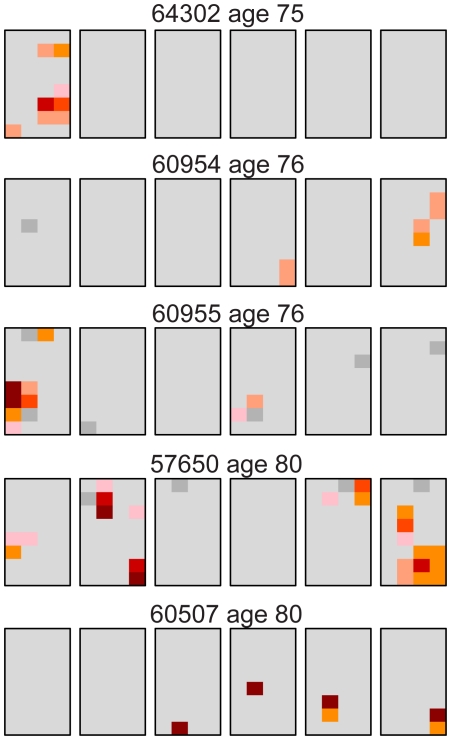
Figure 2. Distribution of the Apert syndrome c.755C>G mutation for the oldest age group (75–80 years).
These are the same testes as the oldest age group shown in Figure 1. For the Apert mutation, unlike the MEN2B mutation in Figure 1, all of the older testes have substantial mutation clusters. The color code is the same as in Figure 1.

