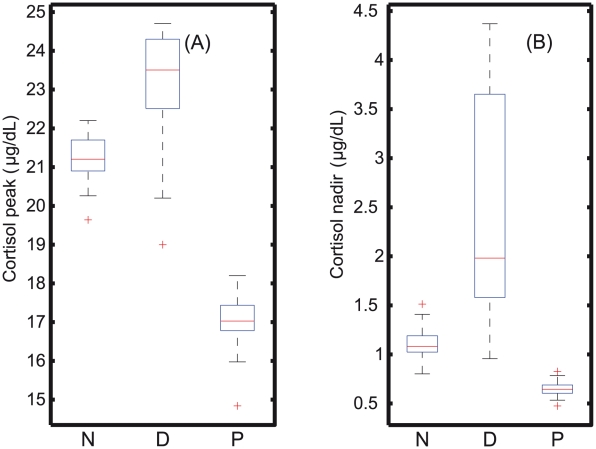
Figure 6. Whisker plots of the peak and nadir cortisol levels of the 50 phenotypes.
(A) Peak and (B) nadir levels of the cortisol for the normal (N), PTSD (P), and depressed (D) categories, for which significant group differences are observed (p-value 0.05). For depression, there is a wide range of cortisol values observed at nadir, whereas in PTSD, the range is extremely small, indicating that in depression, due to the weak negative feedback, the fluctuations are found to be enormous that resulted in a wide range of cortisol values.

