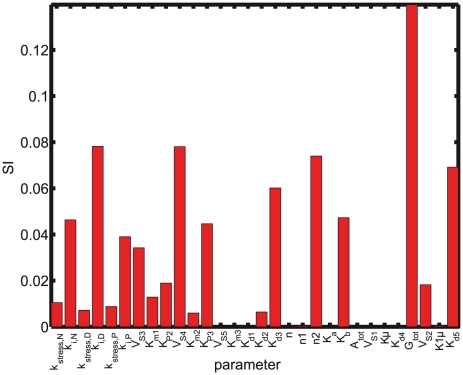
Figure 7. Sensitivity Indices (SI) for the optimal set of parameters.
Sensitivity analysis shows that the sensitivity of cortisol with respect to K for depressed subjects is much higher than for normal subjects, while for PTSD is much lower. This difference is due to the difference in the sensitivity of the HPA axis for normal, depressed, and PTSD subjects. On the other hand, hardly any difference in the sensitivity to k
 is seen. No sensitivity to the Hill coefficient n
 is observed, which is the homodimerization of GR receptor, indicating that the circadian oscillations are due to the other Hill coefficient n
 , that determines the nonlinearity and robustness of the oscillations. The most sensitive parameter is the total glucocorticoid receptor, which plays a strong role in cortisol feedback regulation. This is in tandem with the hypothesis. The insensitive parameters V
 , K
, K , are the enzymatic degradation of the cortisol, while K
 is the autonomous/dilution rate of the CRH. This indicates that in the model cortisol enzymatic degradation is not necessary, because of the strong binding rates (k
 highly sensitive) of the GR receptors and, the autonomous degradation k
 (again highly sensitive), that removes the cortisol much more efficiently than the enzymatic degradation.

