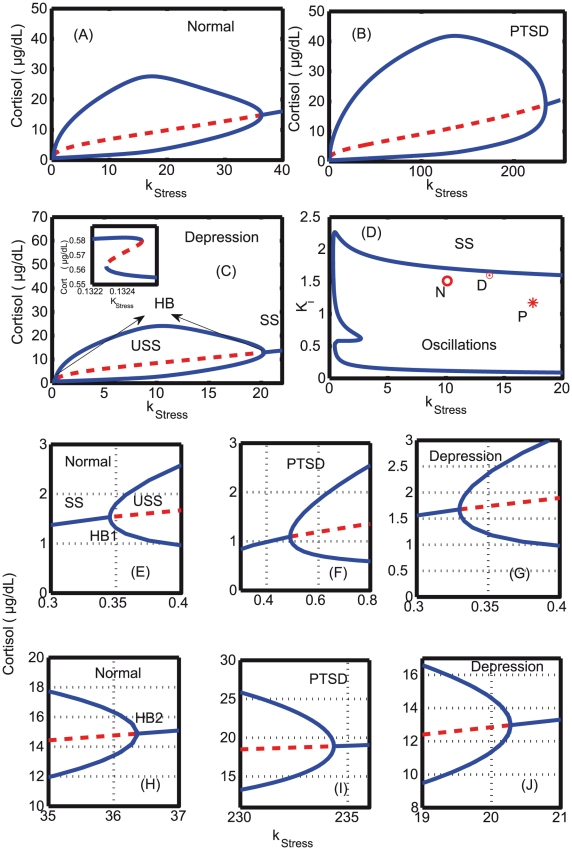
Figure 9. One and two parameter bifurcation analyses.
Bifurcation analysis is carried out for (A) normal, (B) PTSD, and (C) depressed subjects with k as the bifurcation parameter. All the parameters were estimated, and kept constant throughout the simulation except for k
 and K
and K values that are differed in the normal, depressed and PTSD subjects. The parameters are given in Table 1. Initially, for simulating the bifurcation diagram, k
 was chosen as 0.001, a stable steady state. As k
 increased, bistability was only observed in depressed patients (shown as inset in (C)), and Hopf bifurcation (indicated as HB) was observed in all the three subjects. Also, Hopf bifurcation began (E-G) and ended (H-J) at different k
 values in all the three subjects. (D) Two parameter bifurcation diagram indicates the presence of oscillations for a wide range of k
 -K
-K values, and N (circle), D (dotted circle) and P (star) indicates the estimated parameters for which normal, depressed and PTSD subjects lie in the parameter plane. SS–stable steady state, USS–unstable steady state, and HB–Hopf bifurcation which is supercritical in all the subjects.

