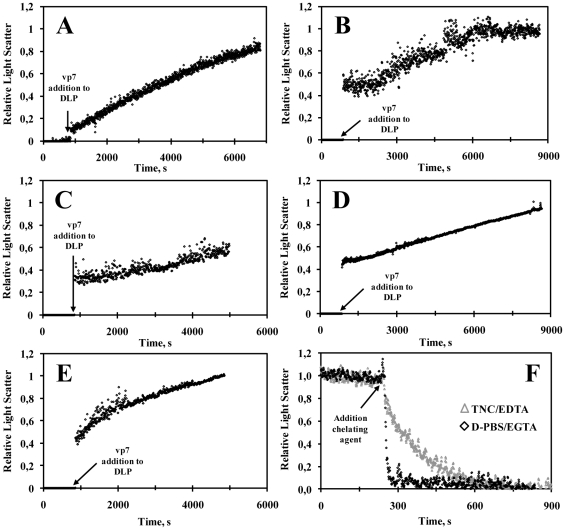
Figure 1. Kinetics of in vitro RLP assembly and disassembly by 90° light scattering.
Transition of DLP to RLP under standard condition (TNC buffer at pH 5.5, 25°C, NaCl 0.1 M and Ca2+ 1 mM) (graph A) and upon increase in pH (8 – graph B), Ca2+ (5 mM – graph C), temperature (35°C – graph D) and NaCl (0.5 M – graph E). Dissociation of RLP to DLP at 25°C in TNC with 1 mM of EDTA (grey triangle) or in D-PBS with 1 mM of EGTA (black diamond) (graph F). The arrows indicate the times at which vp7 was added to DLP (graphs A to E) or the addition of chelating agents (graph F).

