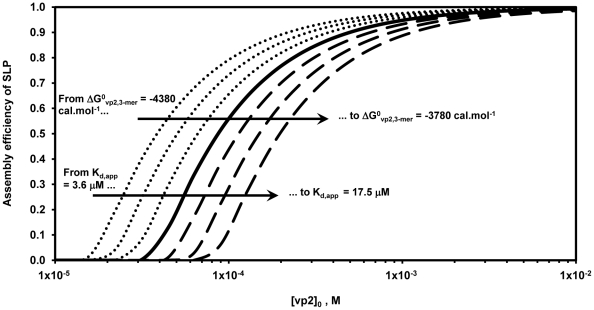
Figure 2. SLP assembly efficiency as function of the initial vp2 concentration, [vp2]0, for different Gibbs free energy of vp2 subunit association values, ΔG0 vp2,3-mer.
The full line represents ΔG0vp2,3-mer = −4.08 kcal.mol−1 as estimated by Zlotnick 1994, the dash lines represent ΔG0vp2,3-mer>−4.08 kcal.mol−1 and the dot lines represent ΔG0vp2,3-mer<−4.08 kcal.mol−1. Kd,app represents the pseudo-critical concentration that satisfies the constraint [1] (concentration of unassociated vp2 subunits at equilibrium - [1] = [svp2]e) = [20] (complete SLP) = Kd,app at equilibrium for a specific ΔG0vp2,3-mer.

