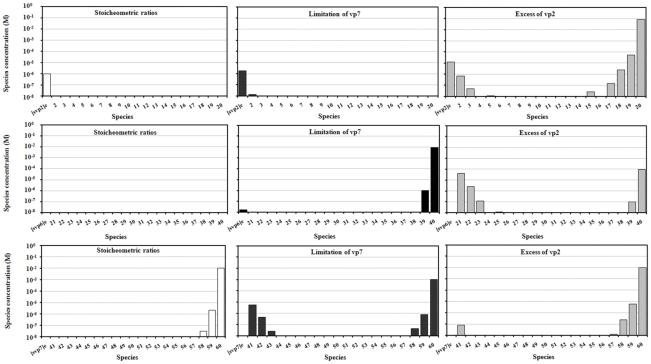
Figure 4. The concentration of assembly intermediates for three initial protein concentration scenarios:
1) [vp2]0 = 1.2 M, [vp6]0 = 7.8 M and [vp7]0 = 7.8 M (stoichiometric ratios – white bars); 2) [vp2]0 = 1.2 M, [vp6]0 = 7.8 M and [vp7]0 = 0.78 M (limitation of vp7 – black bars); 3) [vp2]0 = 12 M, [vp6]0 = 7.8 M and [vp7]0 = 7.8 M (excess of vp2 – grey bars). The Gibbs free energy of vp2, vp6 and vp7 subunit association was assumed to be equal (ΔG0vp2,3-mer = ΔG0vp6,13-mer = ΔG0vp7,13-mer = −4.08 kcal.mol−1).

