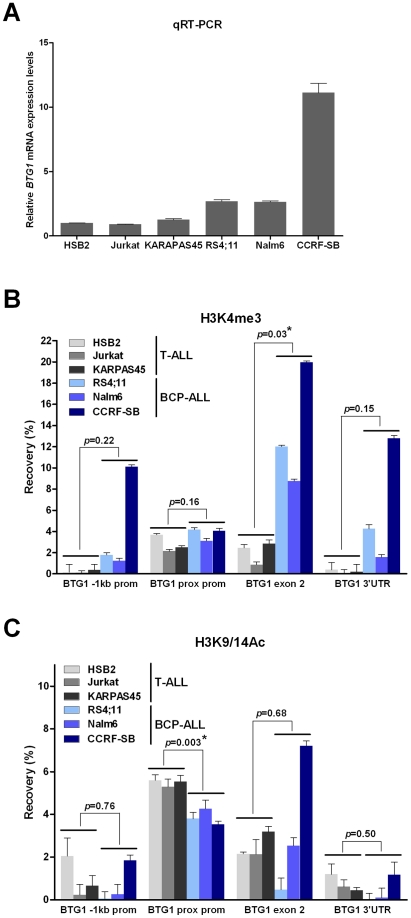
Figure 4. Increased levels of H3K4me3 at the BTG1 locus in BCP-ALL versus T-ALL cell lines.
(A) Quantitative real-time RT-PCR data representing relative expression levels of BTG1 in T-ALL cell lines HSB2, Jurkat and KARPAS45, and BCP-ALL cell lines RS4;11, Nalm6 and CCRF-SB (HPRT normalized and related to HSB2 expression levels). Data shown are the average of two independent cDNA reactions and triplicate qRT-PCR reactions. (B and C) Percentage recovery after ChIP performed with H3K4me3 antibody (B) or H3K9/14Ac antibody (C) on T-ALL (HSB2, Jurkat, KARPAS45) and BCP-ALL (RS4;11, Nalm6 and CCRF-SB) cell lines. Real-time quantitative PCR was performed with primers specific for the region 1 kb upstream of the transcription start site (−1 kb prom), directly flanking the transcription start site (prox prom), the second exon near the breakpoint hotspot (exon 2) and towards the end of the 3′untranslated region (3′UTR) at the second (and last) exon of the human BTG1 gene. Values represent two independent ChIP experiments. Student's t-test was performed to assess differences between the average recovery of T-ALL versus BCP-ALL samples. Asterisk (*) indicates a p-value<0.05.

