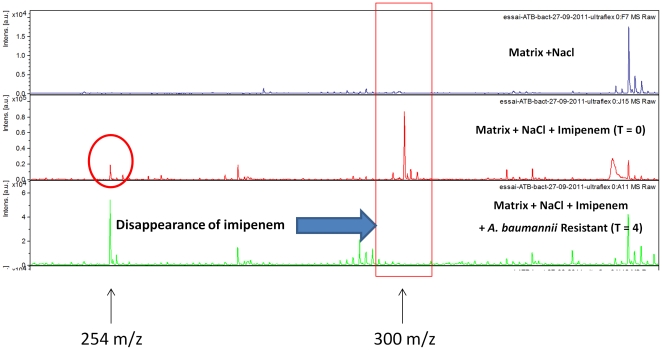
Figure 2. Mass spectra of the imipenem hydrolysis assay with a carbapenem-resistant A. baumannii strain.
Incubation at 37°C during 4 h; NaCl 0.45%; imipenem concentration 0.25 mg/mL. Units of the x axis represent the mass per charge in Daltons [m/z (Da)] and that of the y axes, the relative intensity (a.u., arbitrary units).

