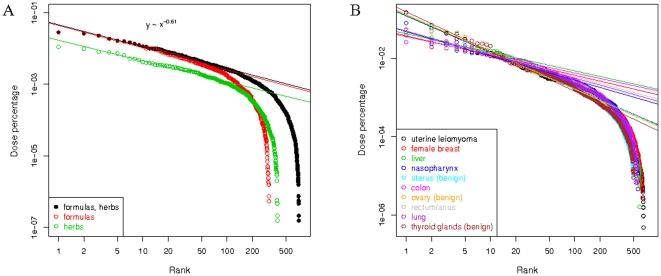
Figure 1. Zipf distributions of TCM formulas and herbs to cancers.
The percentage weight of a formula or herb in a prescription is calculated. The weights are averaged over individual cancers, and then over the 30 cancer types. Formulas and herbs are ranked according to the averaged weights. (A) Weights averaged over the 30 cancers are plotted against their ranks. Note of the log scale of the axes. Lines are linear regressions to their top 50 formulas and/or herbs. The slopes of the lines give the Zipf exponents. (B) Weights over individual cancers are plotted against their ranks. Lines are linear regression fits to their top 20 formulas and herbs.

