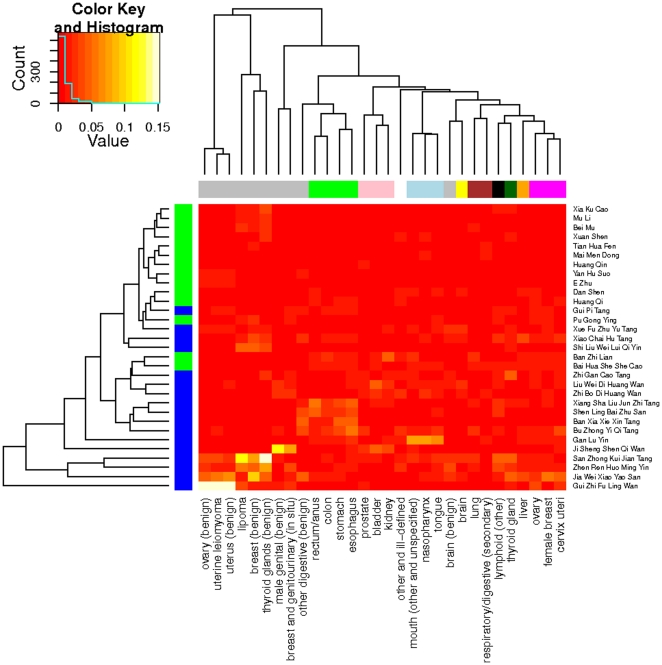
Figure 2. Heatmap and hierarchical clustering of cancers and TCM formulas/herbs.
Cancers similar in terms of the prescribed TCM formulas and herbs are clustered and shown within the branches of the tree on the top. Horizontal color stripes encode cancer types. For example, benign neoplasms are in gray. Formulas and herbs that are similar in terms their usage across the cancers are clustered and shown on the left tree. Blue color in the vertical color bar indicates formulas while green indicates herbs. The heatmap shows only the 30 heaviest formulas/herbs. Color key and histogram show the value and distribution of the percentage weights. Figure S4 is the heatmap with all the 746 formulas and herbs.

