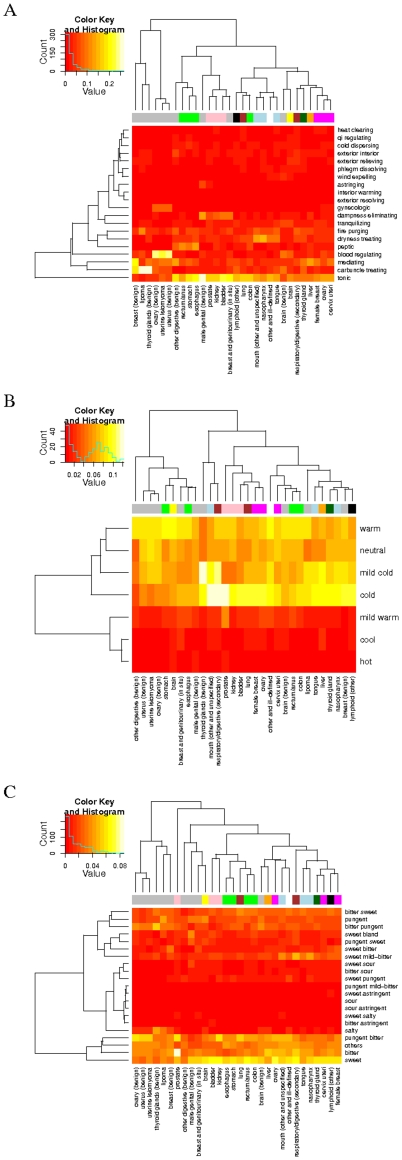
Figure 3. Heatmap and hierarchical clustering of cancers and TCM categories, natures, and flavors.
The effect of a TCM formula is classified into one of the 21 TCM categories. The average percentage weight of a category in the prescriptions to each cancer is calculated. In (A) shows the heatmap of the cancer by category weights. Similarly, an herb is designated its TCM nature and TCM flavor. The heatmaps of the cancer by nature and cancer by flavor weight matrices are shown in (B) and (C).

