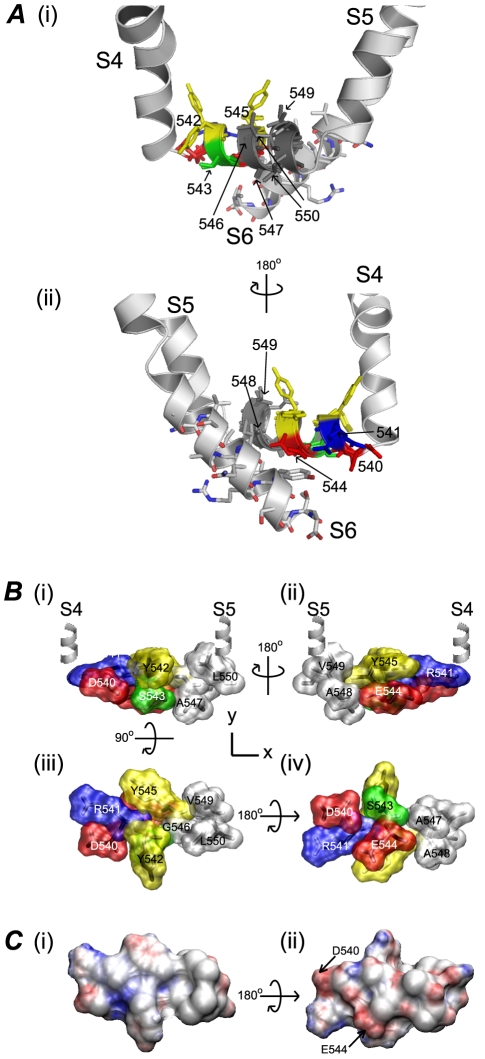
Figure 2. Surfaces of hERG S4–S5 linker.
A. NMR structure of hERG S4–S5 linker, from Asp540 to Leu550, superimposed on to the hERG homology model generated using Kv1.2 crystal structure [36] as the template. Only one subunit is shown here for clarity. Each segment is labelled accordingly from S4 to S6. Residues from Asp540–Leue550 are coloured-coded based on their sidechains as in Fig. 1C. View (ii) shows the proximity of the S4–S5 linker to the residues from the S6 in the open state. B. Surface representation of residues Asp540–Phe550. Views shown are: (i) and (ii) S4–S5 linker parallel to the membrane with S4 and S5 helices at either end; (iii) membrane buried and (iv) solvent exposed surfaces. C. The surface electrostatic potential was calculated using APBS software [50]. The membrane-buried surface (i) is neutral whereas the solvent exposed surface (ii) has an overall small negative charge.

