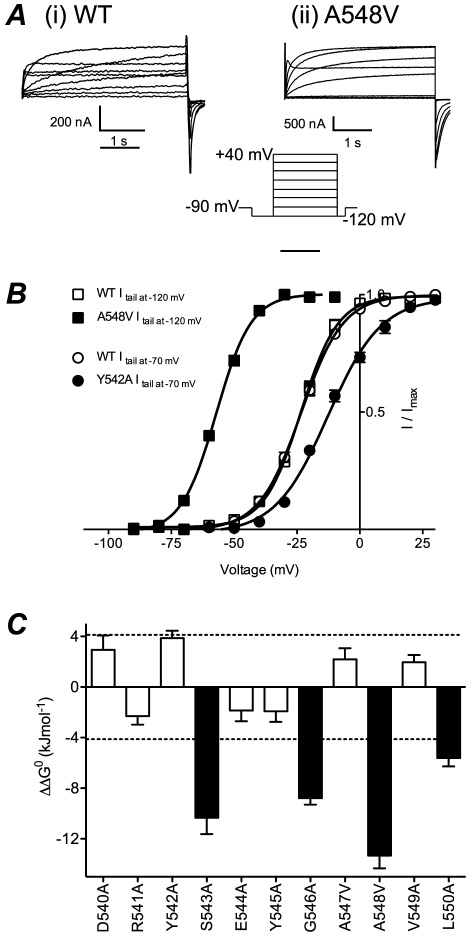
Figure 3. Steady-state activation of hERG S4–S5 linker mutants.
A. Typical examples of current traces recorded from (i) WT and (ii) A548V hERG channels using voltage protocol shown in inset. B. Plots of normalised peak tail currents versus test voltage for WT channels, where tail currents were recorded at −120 mV (open squares) or −70 mV (open circles) and for A548V recorded at −120 mV (closed squares) and Y542A recorded at −70 mV (closed circles). In each case the data have been fitted with a Boltzmann function. C. Summary of perturbations to ΔG 0 of steady-state activation caused by each mutant compared to WT. Filled blocks indicate mutants where ΔΔG 0 was >4.2 kJ mol−1.

