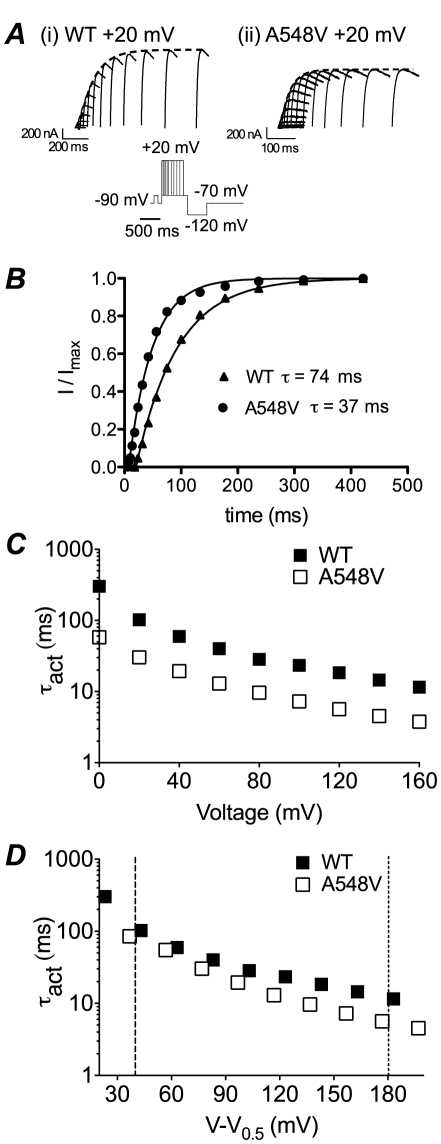
Figure 4. Activation of hERG S4–S5 linker mutants.
A. Examples of tail currents recorded at −70 mV from (i) WT and (ii) A548V channels after varying the duration of steps to +20 mV. Dashed lines show single exponential fits to the envelope of peak tail currents. B. Plot of peak tail currents, from experiments shown in panel A, for WT and A548V channels. The fitted single exponential functions had time constants of 74 ms for WT and 37 ms for A548V. C. Plots of time constant of activation for WT (filled squares) and A548V (open squares) channels at voltages between 0 and +160 mV. D. Plots of time constants of activation for WT and A548V versus voltage after correcting for differences in the V 0.5 of activation. Note that the time constants of activation for A548V are no longer markedly different from WT after correcting for differences in the V 0.5 of activation. The dashed lines indicate the voltages (V = V 0.5+40 mV and V = V 0.5+180 mV) at which comparisons were made for time constants of activation for all mutants.

