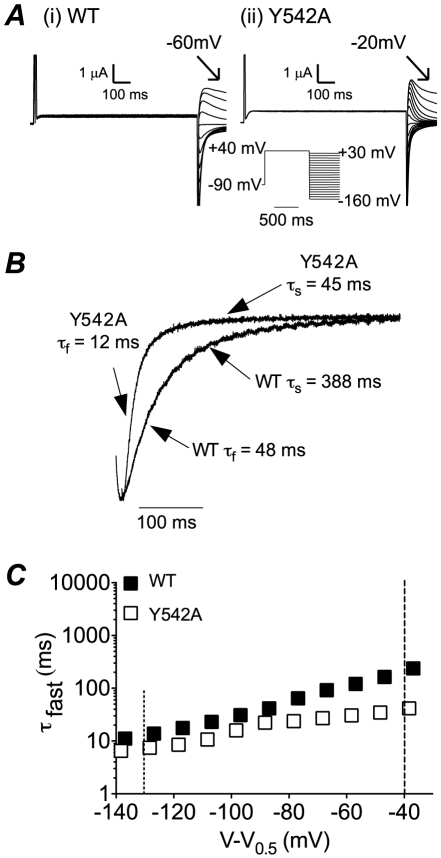
Figure 6. Deactivation of hERG S4–S5 linker mutants.
A. Typical examples of families of current traces recorded from (i) WT and (ii) Y542A channels during the voltage protocol shown in the inset. B. Expanded version of tail currents recorded at −110 mV to highlight the much faster deactivation of Y542A compared to WT. C. Plots of time constants of deactivation for WT (filled symbols) and Y542A (open symbols) versus voltage after correcting for differences in the V 0.5 of activation. The dashed lines indicate the voltages (V = V 0.5−40 mV and V = V 0.5−130 mV) at which comparisons were made for time constants of deactivation for all mutants.

