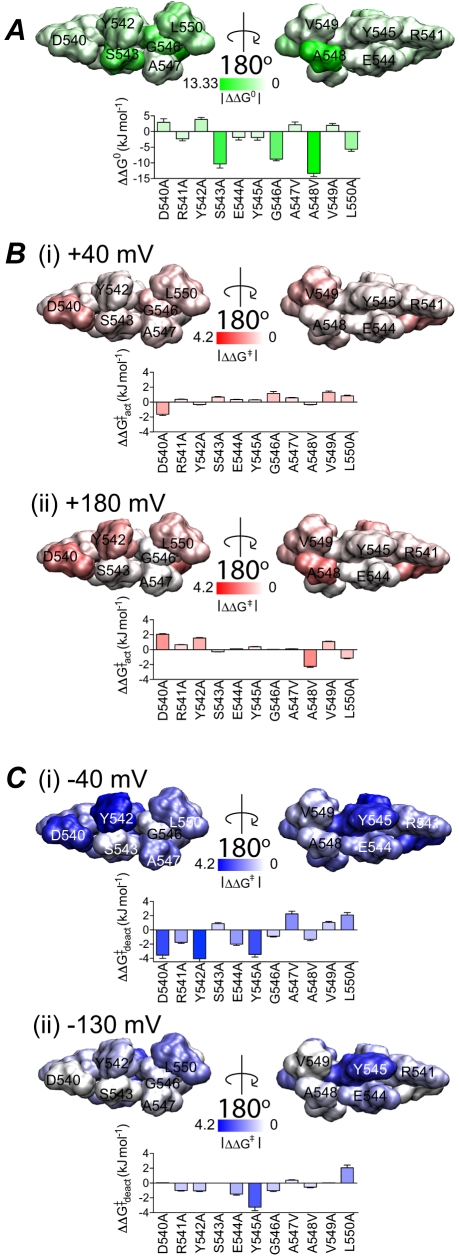
Figure 8. Energy perturbation of S4–S5 linker mutants.
The energy perturbation caused by mutations for steady-state activation, rates of activation and deactivation are shown as absolute values and mapped onto the S4–S5 linker viewed parallel to the membrane. The colour scale in steady-state activation A, was normalised to the value corresponding to the largest perturbation (−13.33 kJ mol−1) whereas in the case of activation B, and deactivation C, the colour scale spans 0 to 4.2 kJ mol−1. B. Perturbations to rates of activation measured at (i) a low voltage gradient: V = V 0.5+40 mV and (ii) a high voltage gradient: V = V 0.5+180 mV. C. Perturbations to rates of deactivation (fast component) measured at (i) a low voltage gradient: V = V 0.5−40 mV and (ii) a high voltage gradient: V = V 0.5−130 mV.

