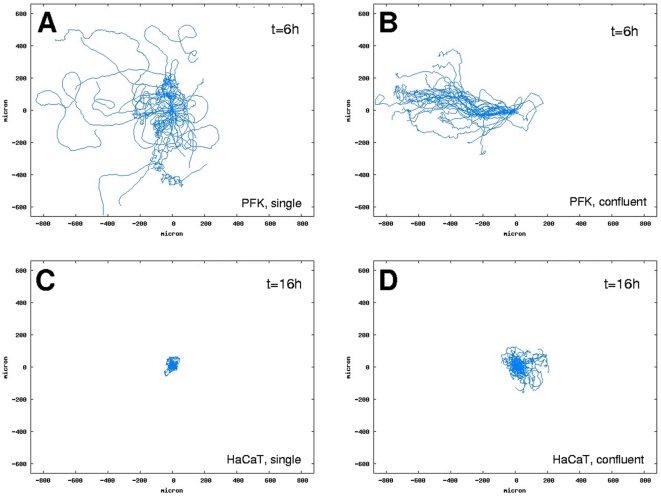
Figure 3. Comparison of trajectories at different cell densities.
Superposed trajectories of primary goldfish keratocytes (PFK) (A and B) and HaCaT keratocytes (C and D) migrating either as single cells or in clusters for durations t = 6 h (A and B) or t = 16 h (C and D). Trajectories of 30 randomly selected cells are shown in each panel. Note the increase in linear trajectories in panels B and D compared to panels A and C.

