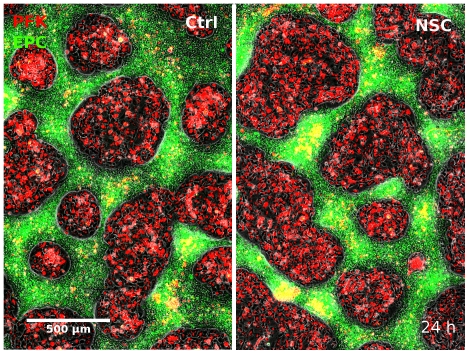
Figure 7. Comparison of cell cluster formation without/with Rac1 inhibition.
Comparison of fields of views showing developing clusters in mixed co-cultures of primary goldfish keratocytes (PFK, red) and EPC fish keratocytes (green) 24 hours after seeding. Untreated culture (A) is compared with the culture treated with 30 uM Rac1 inhibitor NSC-23766 (B). Note the larger red PFK clusters in B. See also Video S8.

