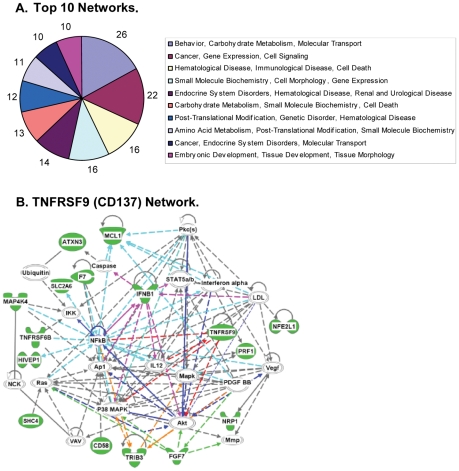
Figure 3. Network Analysis.
(A) Top hits involved in ten significant networks identified by Ingenuity pathway analysis. The numbers surrounding the pie charts represent the number of the top hits involved in each network. (B) 16 hits (highlighted in green) are in a network linked to a category designated as ‘hematological disease, immunological disease, cell death’, which includes TNFRSF9/CD137. Connection lines ⁃⁃, represent direct interactions; ----, represent indirect interactions.

