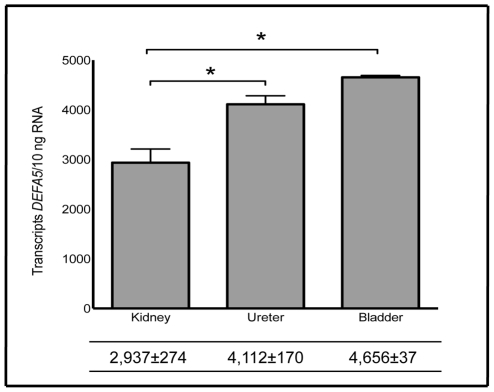
Figure 1. Expression of DEFA5 in human kidney, ureter, and bladder.
DEFA5 mRNA transcript levels were quantified by real-time PCR in non-infected kidney, ureter, bladder. Shown are the results of three independent samples. In the table below, the mean transcript levels are shown with the SEM. DEFA5 expression was significantly greater in the lower urinary tract (p = 0.014).

