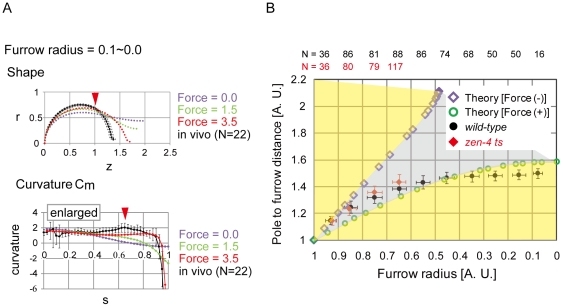
Figure 2. Cell shape under the spatially constant bending modulus.
(A) Comparison of cell shapes and curvatures between in vivo (black) and the spatially constant Kc model (colored) under the same cell volume and surface area as the in vivo cells. The values of the contractile ring force (Force) are shown. Higher Cm was observed in vivo (red arrowhead), and the corresponding position is shown in the upper panel. r, z, and s are defined in Fig. 1B. Error bars denote S.D. (B) Comparison of pole-to-furrow distances between the model and in vivo (wild-type, black circles and zen-4 mutant, red diamonds). Pole-to-furrow distances and furrow radii were theoretically calculated in the model with or without the contractile ring force (Force) = ∞ (green open circles or purple open diamonds, respectively). The region surrounded by the green open circles and the purple open diamonds is shown in gray. Regions outside of the gray region are shown in yellow. The distances and radii were normalized by multiplying the length by (cell volume [unit volume])−1/3.

