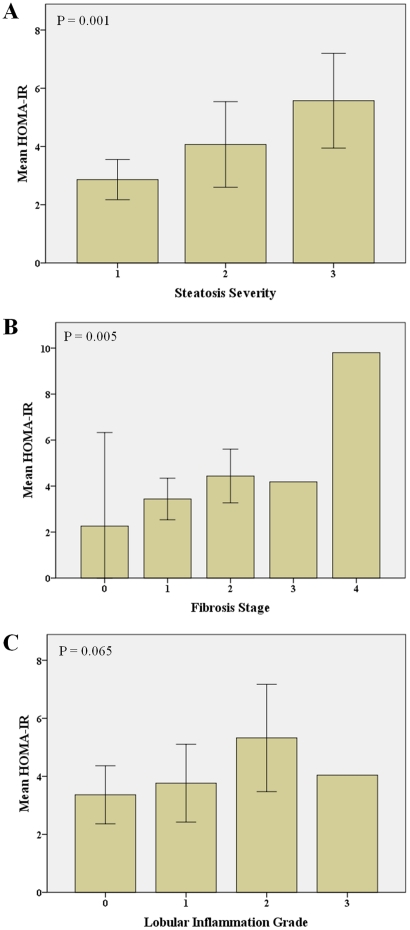
Figure 2. Insulin resistance according to liver histology.
Differences in HOMA-IR according to the severity of steatosis (A), fibrosis stage (B) and lobular inflammatory grade (C). Error bars: 95% CI (not possible to calculate for fibrosis stage 3 or 4 or lobular inflammation grade 3, only one patient). HOMA-IR progressively increased with severity of hepatic steatosis, lobular inflammation and fibrosis.

