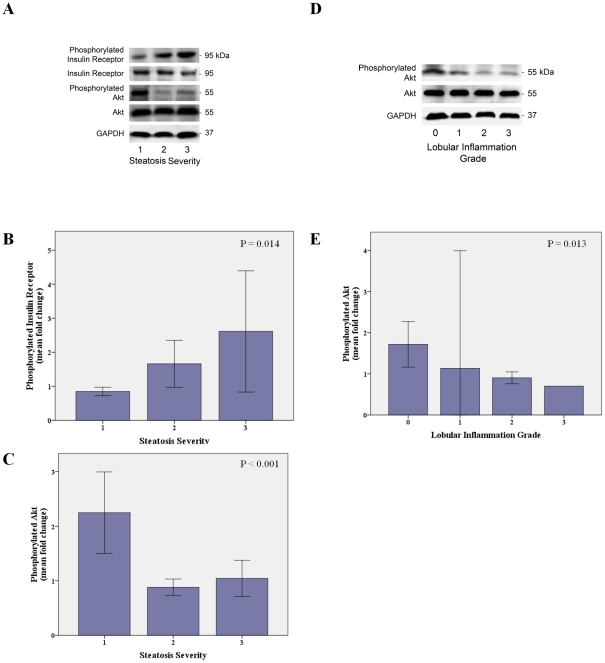
Figure 8. Muscle insulin receptor pathway according to hepatic histology.
Changes in phosphorylated insulin receptor and Akt in muscle tissue with hepatic steatosis severity (A). Insulin receptor phosphorylation in the muscle increases with hepatic steatosis severity (B) and Akt phosphorylation decreases with steatosis (C). Changes in phosphorylated Akt in muscle tissue with hepatic lobular inflammation grade (D). Akt phosphorylation in the muscle decreases with lobular inflammation grade (E). Total proteins were extracted for immunoblot analysis as described. Representative immunoblots for insulin receptor, phosphorylated insulin recptor, Akt, and phosphorylated Akt are shown. Tissue blots of phosphorylated proteins were normalized to corresponding unphosphorylated proteins. Glyceraldehyde-3-phosphate dehydrogenase (GAPDH) was used as loading control. Error bars: 95% CI.

