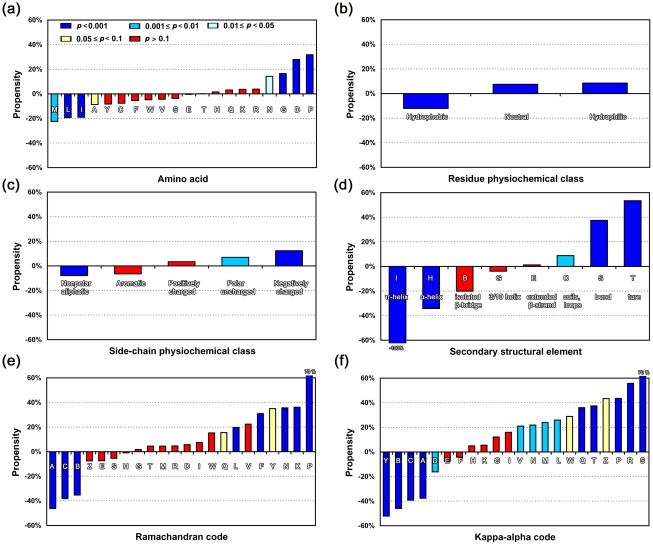
Figure 1. Sequence and Secondary Structural Propensities of Viable CP Sites.
In these charts, each bar shows the relative occurrence of a pattern, e.g., an amino acid, a physiochemical type of residue, or an SSE, for the background polypeptides (in dataset nrCPDB-40) and viable CP sites (in dataset nrCPsitecpdb-40). The background value was considered as the zero point in each experiment; thus, a positive or a negative value means that the frequency of the pattern at CP sites was higher or lower than its frequency in the background. As shown in chart (a), dark blue- to light blue-colored bars represent smaller p-values (<0.05) for the difference between the background and CP site groups. The yellow- and red-colored bars represent p-values≥0.05. Patterns examined in this experiment include: (a) amino acids, (b) residue physiochemical types classified according to [38], (c) side-chain physiochemical types classified according to [39], (d) SSE determined by DSSP [49], (e) Ramachandran code, the backbone conformational alphabet defined by SARST [50], and (f) kappa-alpha code, the backbone conformational alphabet defined by 3D-BLAST [51].

