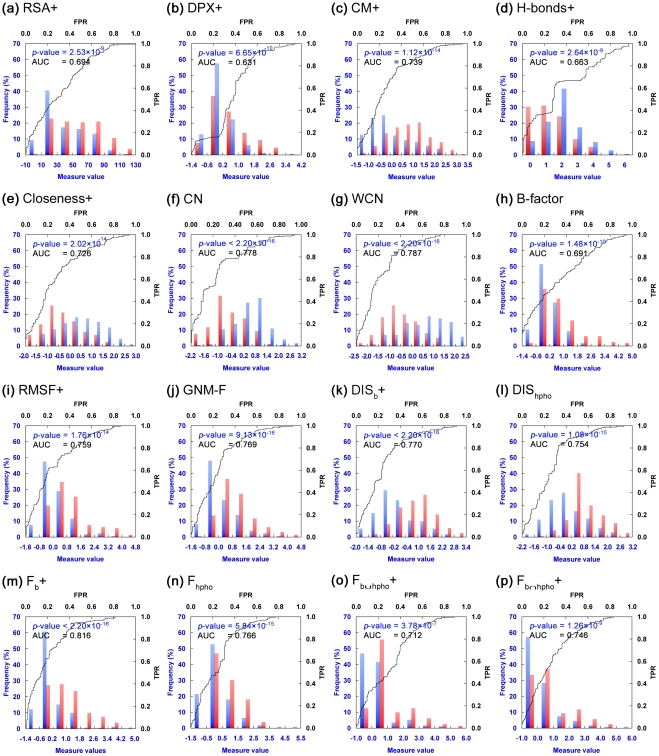
Figure 3. Distribution and ROC Curves of Various Tertiary Structure-derived Residue Measures.
In general, the differences in the distributions of tertiary structure-derived residue measures in viable (red bars) and inviable (blue bars) CP sites of Dataset L were larger and statistically more significant than those of the sequence and secondary structural propensity scores. Their AUC values were also larger in most cases. See Figure 2 for descriptions of the four axes. The abbreviations shown on top of each plot stand for: (a) relative solvent accessibility, (b) residue depth, (c) centroid distance measure, (d) number of hydrogen bonds, (e) closeness, (f) contact number, (g) weighted contact number, (h) atomic mean-square displacement, (i) root-mean-square fluctuation of the Cα atom, (j) Gaussian network model-derived mean-square fluctuation, (k) average distance to the residues located in the buried core, (l) average distance to hydrophobic residues, (m) “farness” (see the main text for definition) from the buried core, (n) farness from hydrophobic residues, (o) farness from the union set of residues in the buried core and hydrophobic residues, and (p) farness from the hydrophobic residues located in the buried core. A plus (+) after an abbreviation for certain measures indicates that hydrogen atoms were restored/added before those measures were calculated. If the definition or algorithm of a measure did not consider hydrogen atoms, or if it made no difference to the results whether hydrogen atoms were present, that measure was computed without adding hydrogen atoms.

